Kosovo COVID-19 epidemiological situation projections using R
Dear members,
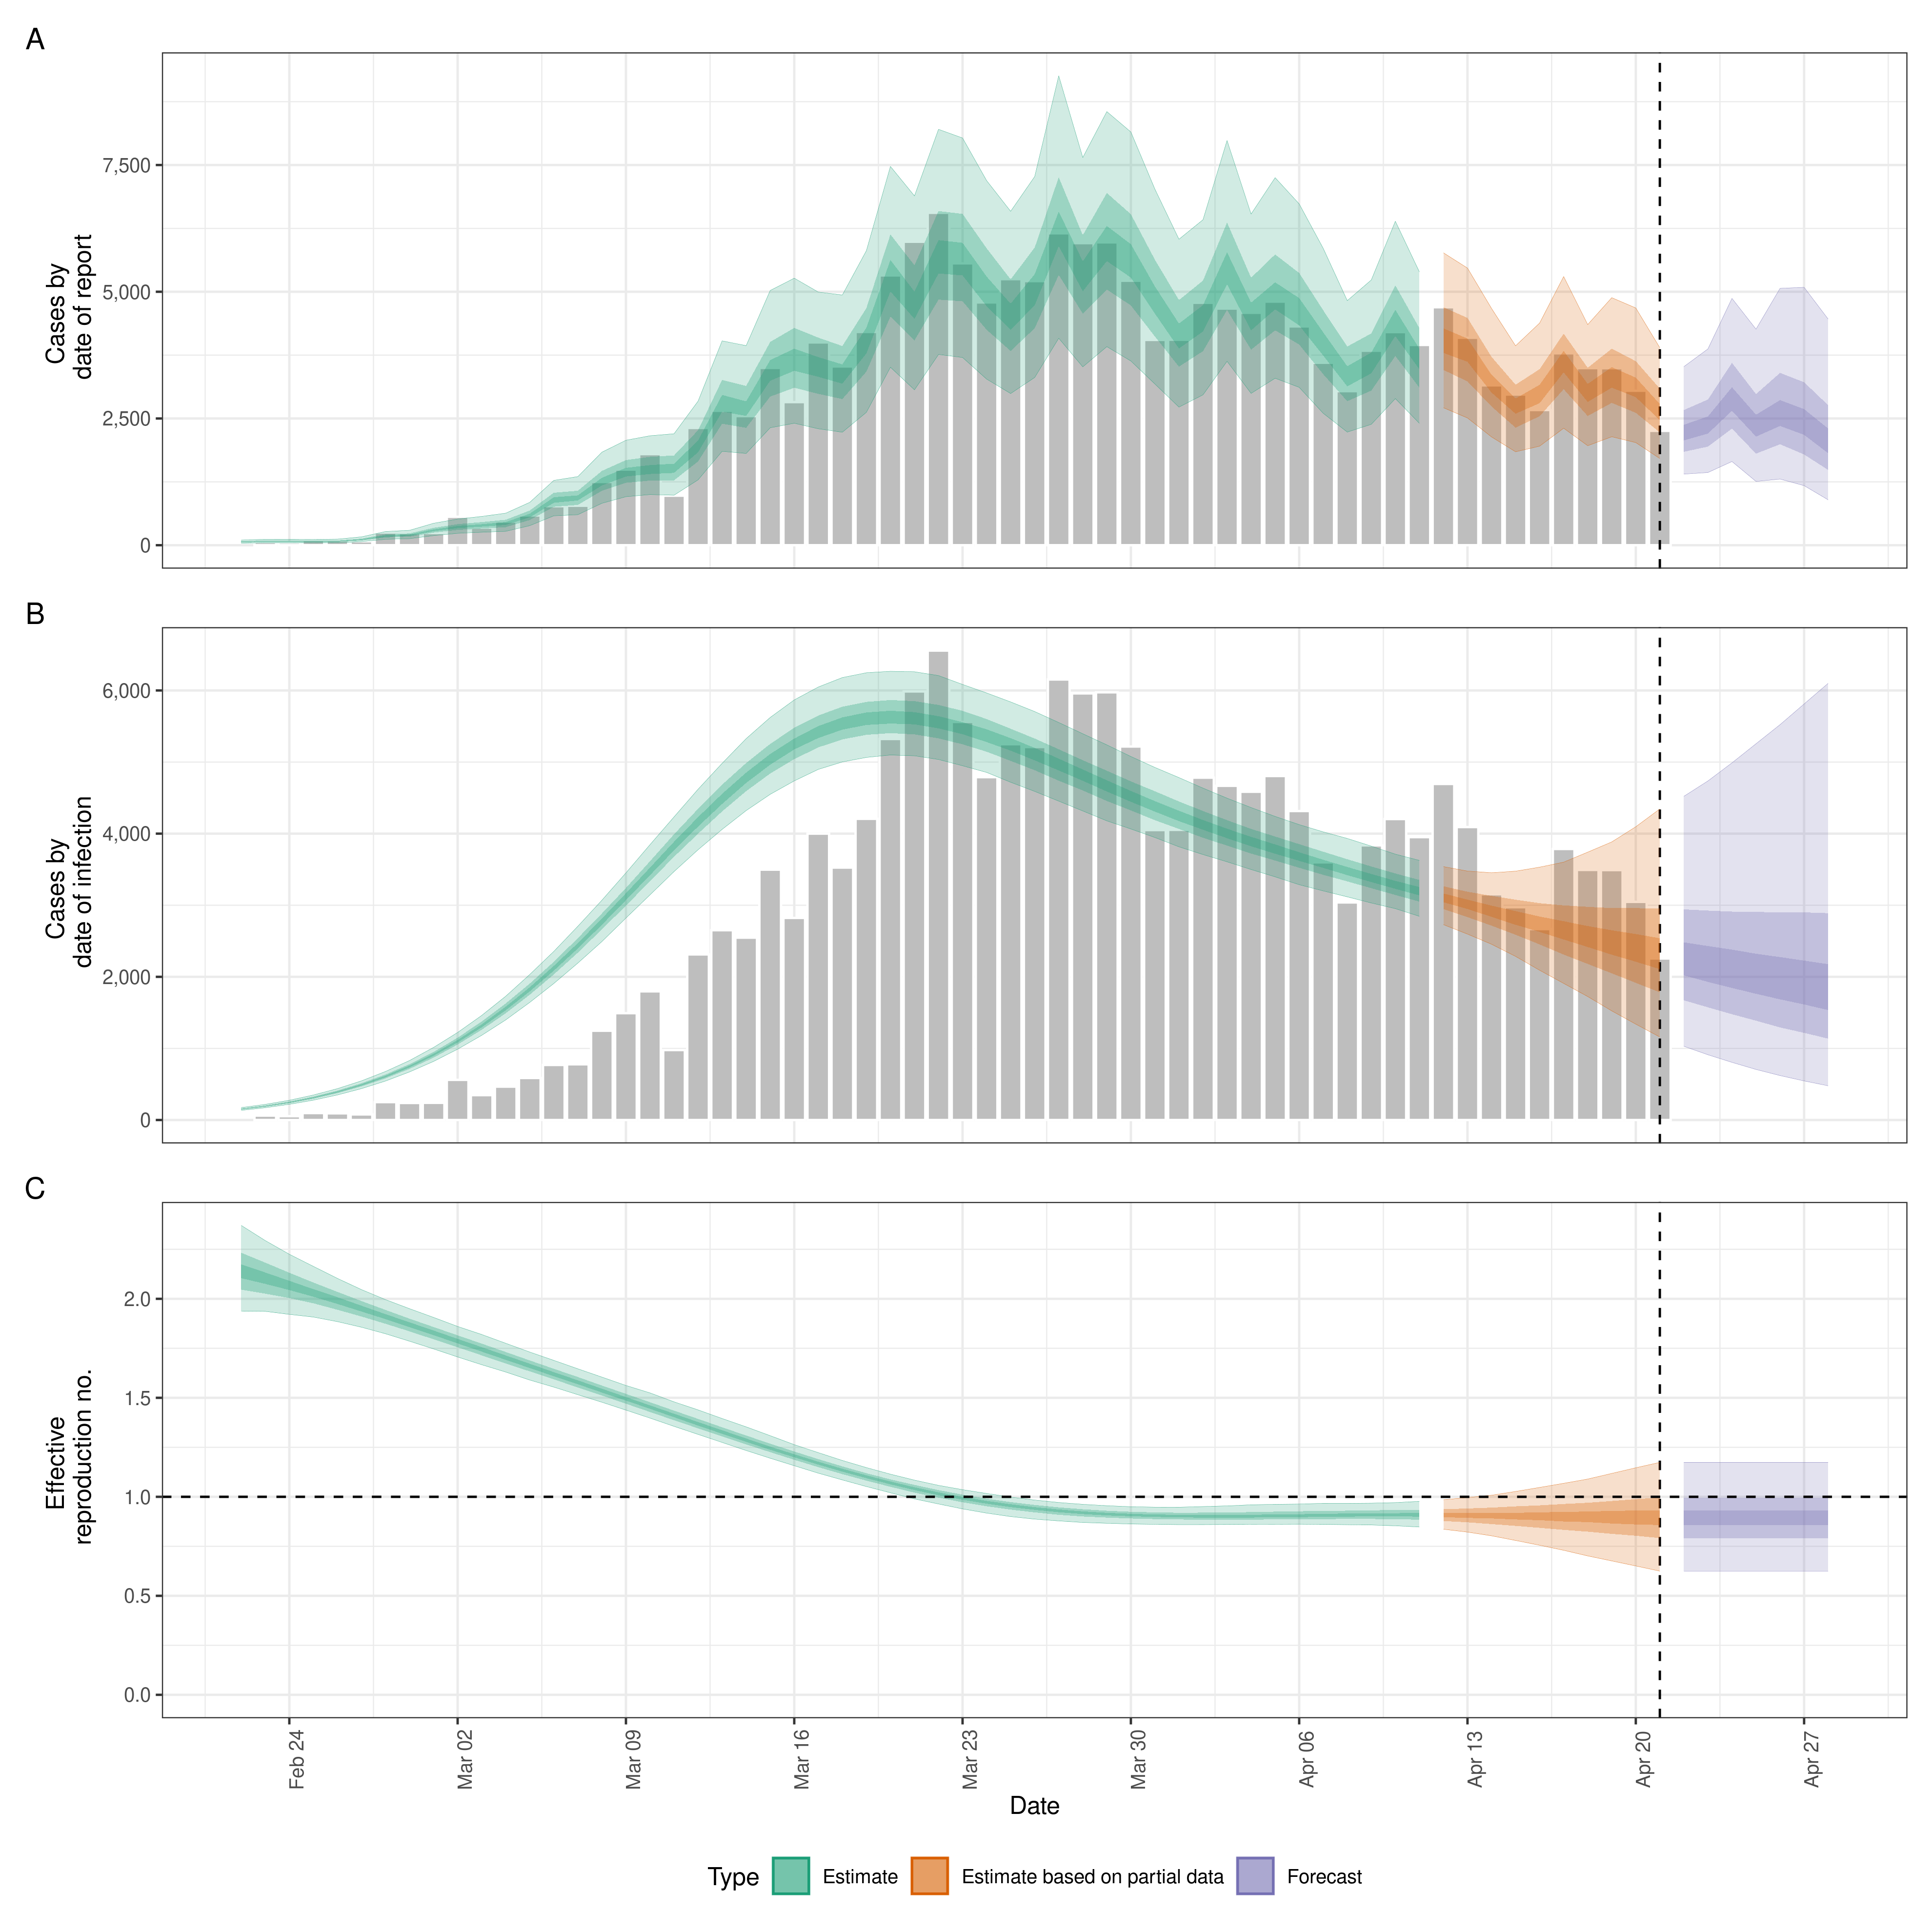
Since a few years, I have been using R to do projections and predictive analysis using R for COVID-19 epidemiological situation in Kosovo. I’ve been using EpiNow2 package, with other personal coding as well. This package estimates the time-varying reproduction number, growth rate, and doubling time using a range of open-source tools (Abbott et al.), and current best practices (Gostic et al.). It aims to help users avoid some of the limitations of naive implementations in a framework that is informed by community feedback and is actively supported.
The coding is below:
# Aktivizimi i pakos kryesore
library(EpiNow2)# nese nuk eshte e instaluar, duhet te perdorni komanden install.packages(EpiNow2) dhe pas instalimit, ta aktivizoni me komanden e mesiperme
# percaktimi i numrit te procesoreve te kompjuterit qe nevojiten me i pergatit modelimet
options(mc.cores = 4)# referenca nga literatura – parametrat nderkomtare te SARS-CoV-2 (koha e inkubacionit, generacionit)
generation_time <- get_generation_time(disease = “SARS-CoV-2”, source = “ganyani”, max=10)
incubation_period <- get_incubation_period(disease = “SARS-CoV-2”, source = “lauer”, max=10)# definimi i vonesave ne raportim si logaritem i mesatares prej 4 ditesh dhe sd prej 1 ditesh ne mungese te evidences.
reporting_delay <- list(mean = convert_to_logmean(4, 1),
mean_sd = 0.1,
sd = convert_to_logsd(4, 1),
sd_sd = 0.1,
max = 15)# periudha e hulumtimit te rasteve per modelim
dates <- seq(as.Date(“2023-07-01”), as.Date(“2023-08-31”), by = “days”)# numri i rasteve per secilen nga datat e mesiperme (bashkengjitur e ke edhe nje Excel sheet)
confirm <- c(0,0,0,0,2,0,0,0,0,0,0,0,0,0,0,2,1,1,1,0,0,0,0,1,0,0,1,1,0,0,0,0,1,0,0,0,0,0,0,1,1,1,0,1,2,4,3,7,6,5,3,12,0,4,5,8,2,1,6,4,6,7)# krijimi i dataset per rastet e konfirmuara e te raportuara gjate diteve paraprake
reported_cases <- data.frame(date = dates, confirm = confirm)# PERSHKRIMI I ASAJ SE CFARE BEN PAKOJA EPINOW2
# estimate Rt and nowcast/forecast cases by date of infection
# on a 4 core computer this example should take between 2 ~ 5 minutes to run
# to see saved logs view the dated logs folder
# to see saved results see the dated results folder
# some data sets may produce divergent transition warnings
# this is not unexpected and is usually fine (if dts < 1% of samples)
# but is an area of research as we seek to optimise the underlying model.
# If you have some prior knowledge of the scaling between observations and
# reports see ?obs_opts for options.
# If you have some prior knowledge on the truncation in your data or multiple
# snapshots of data see ?trunc_opts for options.
# Note that the default settings may not be appropriate for your use case.
# Kodi eshte i pergatitur perfundimisht. Kujdes me ndryshimet e meposhtme.
out <- epinow(reported_cases = reported_cases,
generation_time = generation_time,
delays = delay_opts(incubation_period, reporting_delay),
rt = rt_opts(prior = list(mean = 1.5, sd = 0.5)),
# here we define the quality of the gaussian process approximation
# if the fit to data appears poor try increasing basis_prop and
# potentially the boundary_scale (see ?gp_opts for details)
# though this will likely increase runtimes.
gp = gp_opts(basis_prop = 0.2),
# in some instances stan chains can get stuck when estimating in
# these instances consider using the future fitting mode by passing
# `future = TRUE, max_execution_time = 60 * 30` to stan_opts and calling
# `future::plan(“multiprocess”)` prior to running epinow this will time out
# chains after 30 minutes but still return results from completed chains
stan = stan_opts(),
horizon = 14,
target_folder = “results”,
logs = file.path(“logs”, Sys.Date()),
return_output = TRUE,
verbose = TRUE)# krijimi i tabeles per te dhenat e pergjithshme
summary(out)# paraqitja grafike e projeksioneve
plot(out)# krijimi i tabeles me knit
knitr::kable(summary(out))
If any support is needed, hit me up! I can also build customized R code for your analysis and projections as well.


I wanted to write down a quick remark to express gratitude to you for the amazing items you are giving out at this website. My long internet research has finally been rewarded with incredibly good facts to talk about with my two friends. I would claim that many of us readers actually are rather blessed to exist in a fabulous website with very many special individuals with very beneficial basics. I feel truly lucky to have discovered the website page and look forward to some more entertaining moments reading here. Thanks a lot again for everything.
You’ve managed to capture something ineffable — your words touch a place that logic alone cannot reach.